Feature available in: PRO and ADVANCED PLANS
(US, UK, Canada, Australia, France and Belgium only)The Heatmap provides an intuitive way to analyze data using colors. By displaying density levels or raw data, you will be able to quickly spot where your target audience is the most concentrated.
This feature in currently available for your areas in the United States, the United Kingdom, in Canada, in Australia, in France and in Belgium. Here’s how to use it :
How to Use the Heatmap
To open the Heatmap, click the heatmap icon in the bottom-left corner of the map.
1. Choose the Data to Display
You can create a heatmap using any data available in Smappen, including:
- Demographics
- Points of Interest
- Your imported dataset
- Custom Metrics.
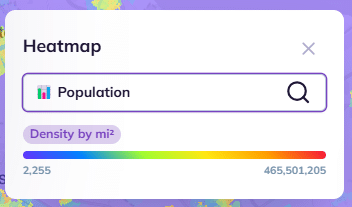
Select your data by browsing the tabs or using the search bar to find a dataset by keyword. Once selected, the heatmap updates automatically: areas with the highest values appear in red, the lowest in blue. Grey areas indicate that no data is available, while purple areas represent a value equal to 0.
2. Adjust the Level of Analysis
You can change the geographic level used for the heatmap (Census units, ZIP Codes, Counties…). This allows you to refine your geographic analysis depending on how detailed you need it to be.
3. View Data Values
Hover over any area on the map to see its exact value. Data can be displayed as:
- Raw values (e.g., total population or per capita income)
- Density values (value per mi²/km² relative to the Census Block surface)
4. Create Areas Based on the Heatmap
Use the heatmap to identify high-potential zones and create optimized territories.
To create an area:
- Click Add an Area
- Choose Manual or Territory
- Open the Analysis Panel to refine and validate your area based on your objectives
The heatmap helps you visually identify the most relevant locations before creating and analyzing your areas.
For further insights:
Heatmap Data Overview
Boundary Levels
- USA: Census unit, ZIP Codes, Counties, States
- UK: Census unit, Postcode sectors, Postcode districts
- Canada: Census unit, Postal codes, Provinces/Territories, Municipalities
Demographic data:
- Choose from 411 US or 71 UK census datasets.
- Data will be displayed by default in density
- NB: Data without a purple label “Density by Km²” are displayed as raw data
My imported data :
- Find the list of your imported data
- You can select the number of results, the sum, or the average
- NB: By default, the number of results is displayed in density, while sums and averages are displayed as raw data
Points of interest :
- Access your saved business and service searches.
- NB: By default, results are displayed in density
My Metrics :
- Shows your created metrics.
- You can choose to visualize data in density or raw data: we recommend density for indicators based on countable data (for example number of inhabitants, numper of POI etc)
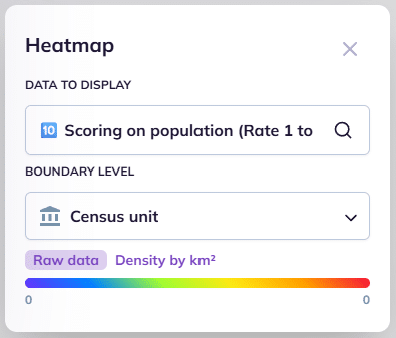
On the heatmap above: I visualize the indicator “score – target” created from a calculation “(number of people aged 18 to 39 / 400000) * 10”