Cartography: What It Is and What It’s For
Remember when you used to go on road trips with a glove box full of paper maps? You had one for each region, they were printed incredibly small, and they were impossible to fold. Thankfully, that ended pretty much the moment everybody got a GPS-capable smartphone in their pocket. So you might be forgiven for thinking that cartography — making maps — is a lost art. But in reality, maps are still absolutely essential, even if they never leave your phone screen.
Let’s dive into the art of cartography, what it’s used for, and common tools used for making maps.
What is cartography?
Cartography, put simply, is the science — and art — of making maps. From the carved clay tablets of our ancestors millennia ago to the 3D models used today, humanity has needed some way to represent the world around us. While, historically, explorers used cartography to find paths to new worlds and create trade routes, its purpose has changed a bit now that we’ve mapped most of the world. Scientists, educators, and even business strategists use maps now.
Once, cartography was about drawing out beautiful, unique pieces based on scraps of information from explorers, the stars, and the occasional manuscript. Now, we have access to satellites, 3D imaging software, and more data than you can shake a stick at.
So what do we do with it?
What is cartography used for these days?
While maps are obviously still essential for navigating the world — whether that’s on land, at sea, or in the air — they’re also useful for a lot more. Here’s how we’re using cartography in the modern world.
Location intelligence
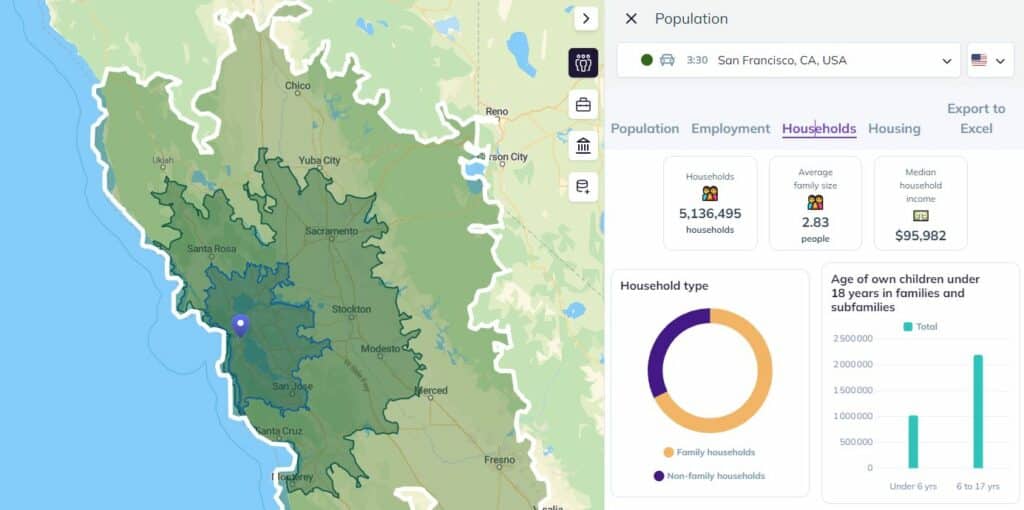
Put simply, location intelligence is the visual representation of geospatial data on a map. Geospatial data is any kind of data that’s tied to a physical location. Addresses, GPS coordinates, and points of interest are all examples of geospatial data. This data is used for analysis in all sorts of fields, from finance to marketing and business strategy.
3D Modeling
No, we’re not talking about fashion models here. When it comes to cartography, 3D modeling is about representing the physical world using computer-generated 3D models. The science comes in creating the most accurate models possible, while still communicating the information that needs to get across. That’s because it’s not always just about making a 1:1 copy of the real world. Sometimes, you need a map that focuses on data more than representing the world. Examples include meteorological data, population information, and seismic data.
Surveying
This discipline covers the measurement of distances and angles between specific points in the real world. Surveying is often done to establish administrative boundaries, plan construction, or carry out the sale of a property. Cartography will usually come into play after data is collected from surveying to draft accurate maps.
4 examples of cartography tools
Historically, cartography only involved a few tools for collecting data and representing it on paper or parchment. Now, the cartography tool box is a lot more full. Here are just a few examples of what cartographers use.
Global-positioning systems (GPS)
Can you believe there was a time when we didn’t all have a GPS unit in our pocket? GPS systems — whether they’re built into your phone or their own dedicated devices — use satellite information to draw maps and pinpoint your location. These are used by hikers to avoid getting lost in the backcountry, drivers trying to navigate a city efficiently, military commanders, businesses, and more.
Satellite and aerial photography
Imagine if ancient explorers had access to satellite photography. Between high-resolution satellite imagery and drone technology, it’s never been easier to get the images necessary to create detailed maps of any location on Earth. After all, any map app you’re using is probably built on satellite imagery.
Sensors
A sensor is any kind of device that picks up some kind of signal and spits out data — that in this case gets used to create a map. Here are some examples of sensors used in cartography.
- Seismometers: These sensors measure motion in the ground, which can be useful for mapping seismic activity in a location.
- Lidar: This acronym stands for “light detection and ranging” and refers to sensors that create detailed 3D maps using lasers. While these sensors can be used to represent all sorts of locations, they’re especially useful for mapping the ocean floor.
- Sonar: Another great tool for picking up signals underwater, sonar uses sound waves to detect objects and create basic maps. Sonar is used to find fish, help unmanned underwater vehicles navigate, and even make planes easier to find if they crash in a body of water.
GIS softwares
GIS stands for Geographic Information System. It is a software system designed to capture, store, manipulate, analyze, manage, and present all types of geographically referenced or spatial data. GIS combines data, such as satellite imagery, maps, and demographic information, with powerful analysis tools to help users visualize, query, and interpret information about the world in which we live.
Smappen
Smappen is a sort of GIS and especially a location intelligence platform that lets you quickly create custom maps for all sorts of needs, from business intelligence to geomarketing and optimizing transportation logistics. Using built-in data — or your own — you can use Smappen to represent catchment areas, isochrone maps, and more. Research your competition, make better business decisions, and serve your customers better, all with one tool.
The best part? You can try Smappen for free here.
Mapping things out
While cartography has been around for thousands of years, it’s understandably come a long way since then. Between apps that put GPS technology in your pocket, advanced sensors, and location intelligence tools like Smappen, cartography gives you access to powerful maps that’ll suit all sorts of needs.
Start using smappen now