 New! Your map just became more intelligent.
 Feature available for all plans: Free – Up to 100 pins | Essential – Up to 1,000 pins | Pro – Up to 10,000 pins | Advanced – Up to 100,000 pins
Once you’ve imported your data, you can display the pinpoints on the map to visualize their distribution and determine how many of them are in a given area.
To view your data on the map, click on the ‘My Data’ button in the analytics and data panel:

This will display a list of your datasets:
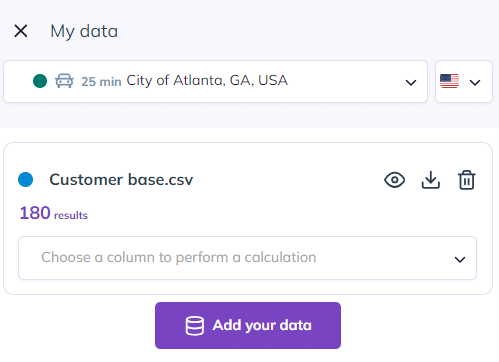
You can modify the colors of the data markers on the map. To do this, click on the color dot and choose from the available color options.
To go further: