
Feature available for all plans: Free – Up to 100 pins | Essential – Up to 1,000 pins | Pro – Up to 10,000 pins | Advanced – Up to 100,000 pins
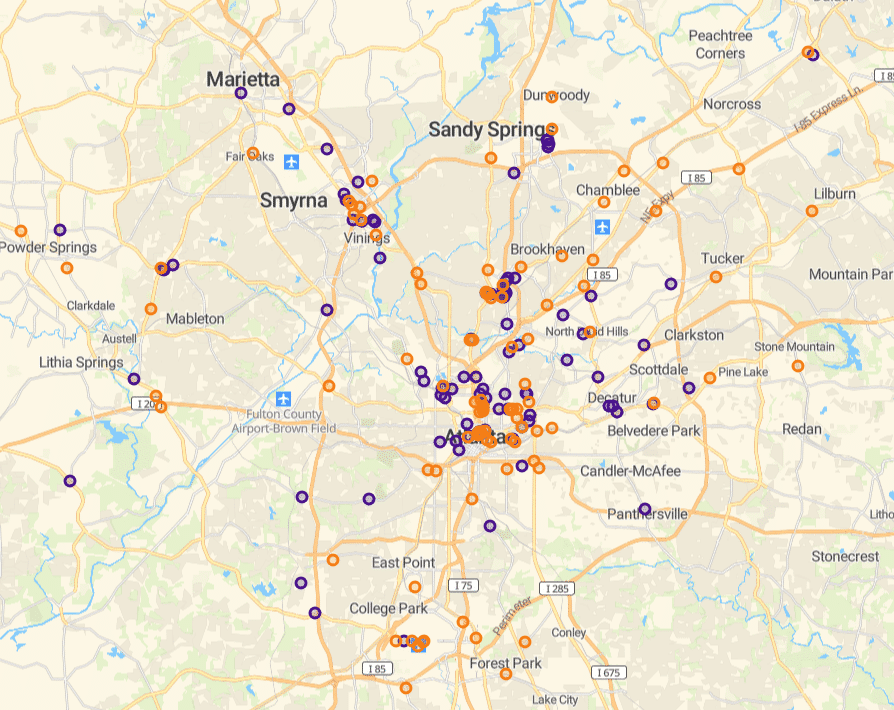
Once you have imported your data, you can display or hide the corresponding pins on the map.
To see your data on the map, click on the “My Data” button on the data-analysis panel:

This will display a list of your datasets:
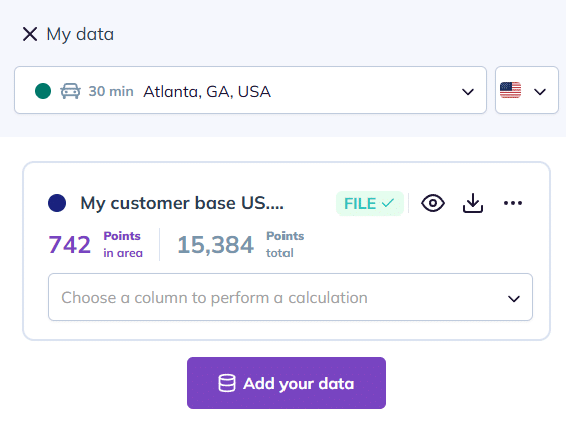
For each of your datasets, you can see the number of pins within the selected area.
To hide all the pins in a dataset, click on this icon ![]()
To display all the pins in a dataset, click on this icon ![]() .
.
You can look at several datasets on the map at the same time. These datasets will be differentiated by color.
To go further: