
The map enables you to view your areas and different kind of data (demographics, points of interest, imported data…).
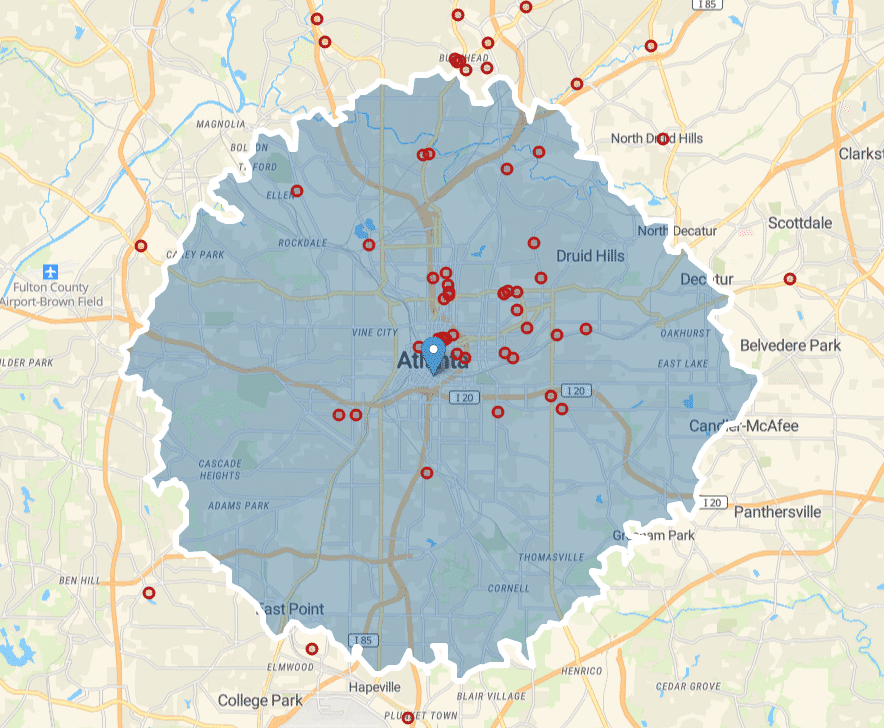
There are several things you can do straight from the map:
- Select an area to analyze: left click on the area.
- Visualize data from your imported pinpoints: hover the cursor over the pin in question.
- Set the starting point for creating a new area: right click on the map, then select “Starting address”.
- Merge two areas: right click on one of the area, then click on “Merge” (see Merging areas)
- Cut out part of an area: right click on one of the areas, then click on “Subtract” (see Subtracting areas)
- Import areas in KML format: to add one or more areas contained in a KML file, use drag and drop to move the file directly onto the map (see Importing areas)
- Easily visualize data with the heatmap (see Visualizing densities)