Feature available in: PRO and ADVANCED PLANS
(US, UK, Canada, France, and Belgium only)You have already discovered the basic features of My Metrics on Smappen, now it’s time to go one step further by performing more complex calculations to analyze your areas more precisely and compare them with each other!
Thanks to the various available operations, you can carry out a wide range of calculations by combining population data and points of interest with your imported data.
Check out some examples of advanced calculations: #
📖 TRANSCRIPT
In this video, we’ll go over a few examples of advanced calculations you can do with Smappen. For example, combining several age groups to target a specific population, calculating your market penetration rate, or scoring your areas to help prioritize your actions.
Combine several age groups to define your target audience:
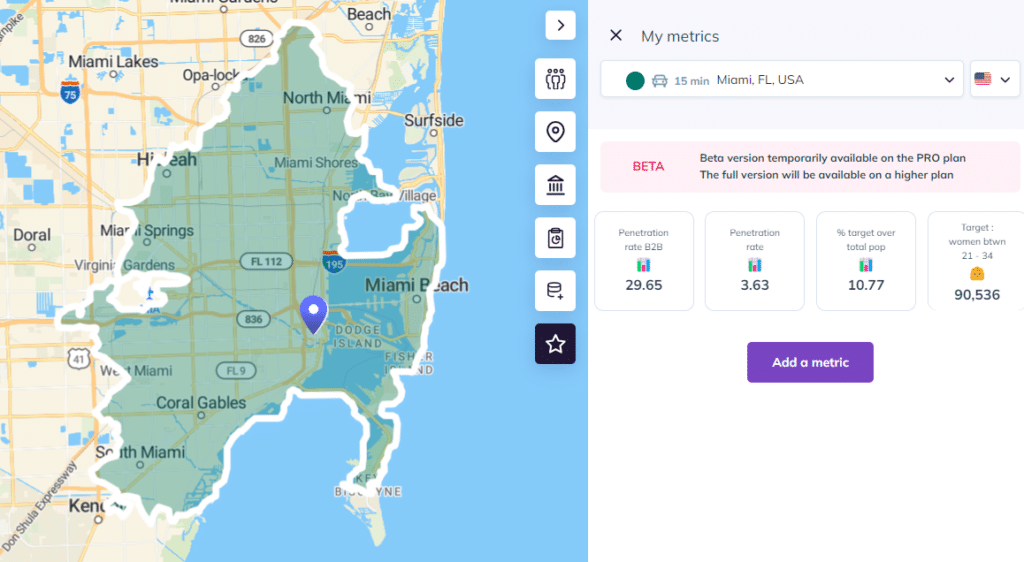
To calculate the size of your target population within an area, go to the My Metrics tab. Here, you can add multiple age groups together, for instance to define women aged 25 to 34. Create a new metric and give it a name. Next, select women aged 25 to 29, then add women aged 30 to 34. Save, and your target is ready.
Calculate your market penetration rate:
You can also calculate your penetration rate to see what percentage of your target you’re actually reaching in a given area by combining imported data with population data. The formula is: Number of clients / Target population x 100. And here it is.
Create a scoring system:
Finally, you can enhance your analysis with a scoring system, which helps you compare areas. The idea is to give a score to each area based on a specific criterion. For example, let’s say you consider an area commercially viable if it has at least 500,000 inhabitants. You can assign a score from 1 to 10. If the area has 500,000 inhabitants, the score is 10 out of 10. To calculate this, use: Population / 500,000 x 10. In Raleigh, that gives me a score of 8.45 out of 10. And now I can compare it easily to my other locations.
Now you know how to use the formula feature to take your analysis to the next level! Now it’s your turn to give it a try!
Want to take it further? Here are some other calculations you can try: #
Perform a calculation on population data: #
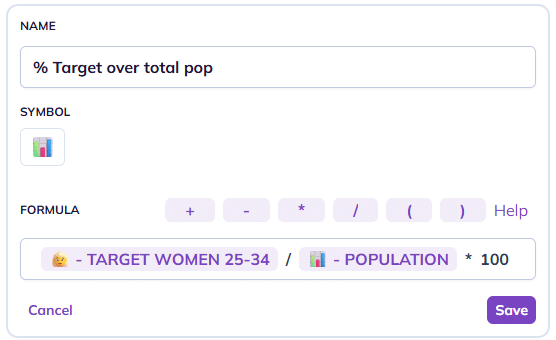
Calculate proportion of your target audience within the total population of your area: #
For example, if my target is women between 25 and 34 years old, I would like to know what percentage my target represents within the total population of my area.
Calculation: (Target Women 25-34 / Total Population) * 100
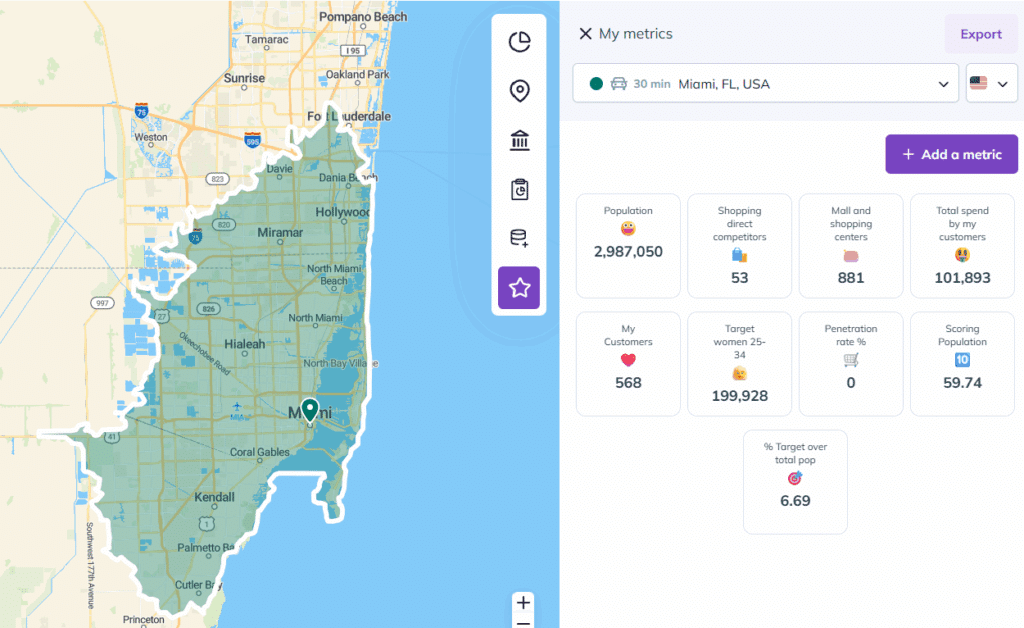
For example, in my 30-minute driving area in Miami, women aged 21 to 39 represent 6,69% of the population
Calculate consumer expenditure potential in my area #
Access the average annual household budget for your product category using consumer expenditure data.
US file:
Source : The Bureau of Labor Statistics (BLS) offers it for access here (latest available data: 2022 with the main trends of 2023).
UK file:
Source : Office for National Statistics offers it for access here (latest available data: 2023).
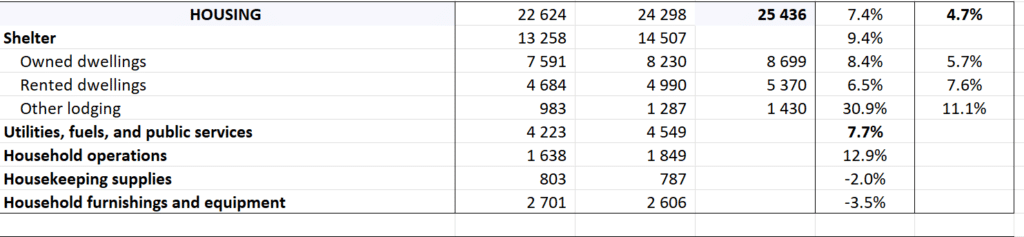
For example, if I’m a furniture retailer, I can see that households spend an average of 2602$ a year on household furnishings and equipement.
I will create my metric using the following formula :
Calculation : Households*2602
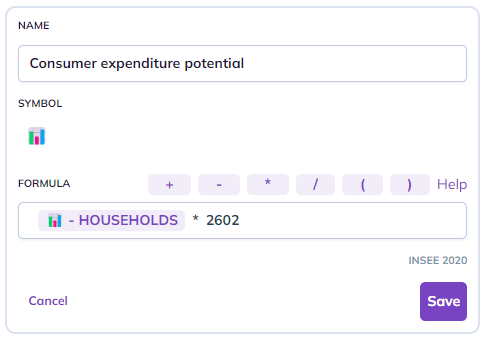
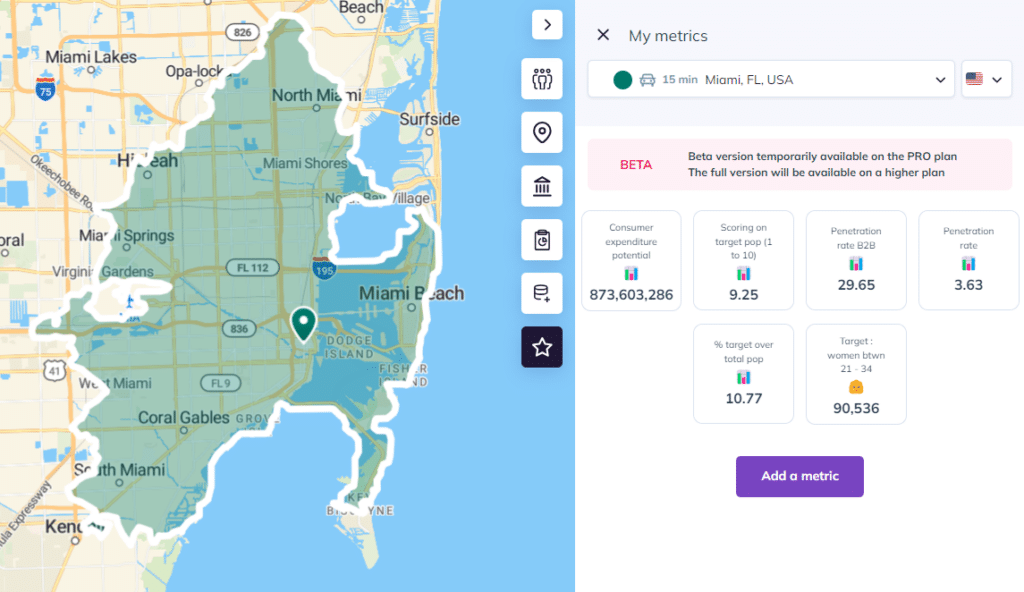
For example in my 15-minute driving area in Miami, the consumer expenditure potential of household furnishings and equipment is 873,603,286 per year.
Perform calculations and analyzes on imported data: #
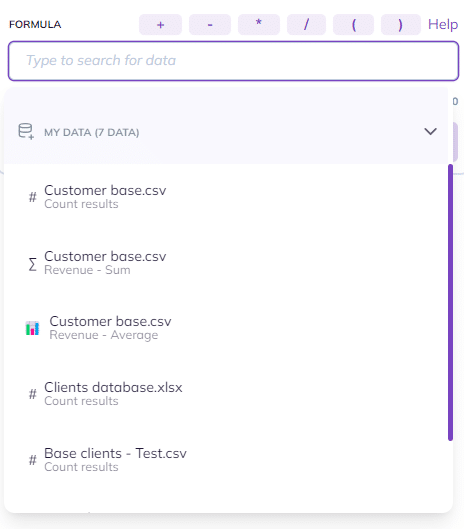
If you have previously imported data onto your map, you can integrate it into My Metrics to perform calculations on this data.
Today, three calculation options are available for imported data:
– Calculation on the number of points
– Calculation on the sum of a column
– Calculation on the average of a column
You can have as many columns as you like:
You can also combine your data with demographic Census data.
Perform calculations and analyzes on Points of Interest searches: #
If you have previously created Points of interest searches, you can integrate the results into My Metrics to use the number of points present in your area in your formulas.
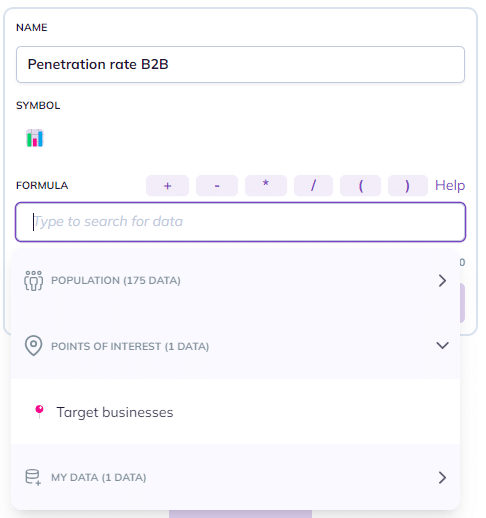
Calculate your market penetration rate – BtoB
Determine the percentage of businesses in the area that constitute your customer base.
Calculation: Number of client businesses / Total number of target businesses in the area x 100
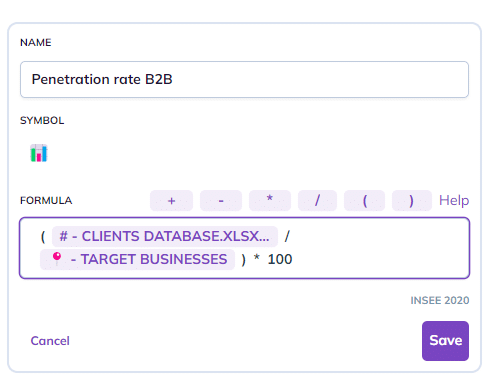
For example, in my area in Miami, my penetration rate is 29,65%.
To go further :