TL;DR - Demographic Analysis Tool
- Demographic analysis helps you understand who lives in an area and what they’ll likely spend — and for budget-savvy business owners or franchisors, using the right tool makes all the difference.
- The online platform Smappen provides a powerful yet affordable way to visualise population, income, household and competitor data—so you can make smart location, marketing and territory decisions.
- The right workflow: define your zone → layer demographic & business data → interpret insights → act (open a store, allocate franchise territory, launch a campaign) — with Smappen you can do that without a full GIS team.
When you’re running a business or a franchise network, you absolutely need to know: “Where are my best customers? What kind of people live around this location? Are there enough of them to support growth?”
Demographic analysis is where you answer those questions with data instead of just intuition. It’s the difference between placing your business by gut–feeling and placing it by statistical evidence of age groups, income levels, household size, etc.
And here’s the kicker: you don’t have to spend a fortune or hire a full GIS (Geographic Information Systems) team to make meaningful decisions. There are cost-effective tools built for business users that let you dig into socio-economic data, overlay it on maps, and draw insights that lead to smarter expansion, marketing and resource allocation.
What to Look for in an Affordable Demographic Analysis Tool
Before you commit to anything, especially if you’re conscious of budget, here are the features you should prioritise (and corresponding functions that the right platform should include):
- Ease of use / no heavy GIS expertise required: You want something business-friendly, not a tool that only doctoral mapping experts can manage.
- Rich demographic data: Population counts, age breakdowns, income levels, household types, employment status — must-haves.
- Flexible zone creation: Whether you want to draw a radius, a drive-time map, ZIP code boundaries, or a custom shape — being able to define your area matters.
- Competitive / point-of-interest data: Knowing where your competitors are, where services or attractions lie, helps you contextualize the demographic numbers.
- Exportable reports and shareable visuals: You’ll likely need to present your findings to stakeholders, investors or potential franchisees — so export and share-capability is key.
- Budget-friendly pricing / scalable: As you grow, your usage may increase — so you want a tool that lets you start small but scale without breaking the bank.
Comparison of Affordable Demographic & Location Analysis Tools
| Tool | Strengths | Notes / Limitations |
|---|---|---|
| Smappen | Designed for business owners and franchisors. Allows users to create zones (radius, drive-time, administrative boundaries), analyze demographics (population, age, income, households), compare multiple areas, import custom data, and export reports. | Focused on business use cases; may have fewer GIS-expert features compared to enterprise-grade GIS software. |
| Social Explorer | Provides detailed demographic datasets, interactive maps, custom filters, and radius-based area exploration. Designed for demographic research and visualization. | Not franchise-focused; may require more learning for users who need territory mapping or business-specific workflows. |
| Geoblink | Offers catchment-area analysis, demographic & socioeconomic data, plus foot-traffic indicators in reports. Built for retail, FMCG, and real-estate decision-making. | Higher pricing and configuration complexity; more suitable for medium-to-large companies than for small businesses. |
Introducing Smappen: A Smart Budget-Friendly Choice
One standout tool that ticks all these boxes is Smappen. It’s built specifically for business owners, marketers and franchisors who need location intelligence without the complexity or cost of enterprise GIS systems. For instance:
- Smappen lets you analyze the demographics of any area … confirm that your target audience is present, and assess the potential of a location.
- The platform emphasise user-friendliness: “map territories, analyze markets, and pinpoint the perfect location — no GIS experience needed.”
- Smappen supports features like drive-time or radius mapping, overlaying data like income, households, employment—ideal for your demographic analysis.
- It’s also explicitly used for franchises. Create balanced franchise territories or import your customer-data.
So if you’re looking to keep costs low but still get meaningful, actionable data — Smappen is a strong candidate.
How to Perform Demographic Analysis in Practice (with Smappen)
Here’s a step-by-step workflow you can apply (and customise) for your business or franchisor network:
- Define your zone
- Pick an area you want to analyze: e.g., a potential store location or a delivery zone.
- Use Smappen to draw a radius (say 10 miles), a drive-time polygon (say 15 minutes), or ZIP/county boundaries.
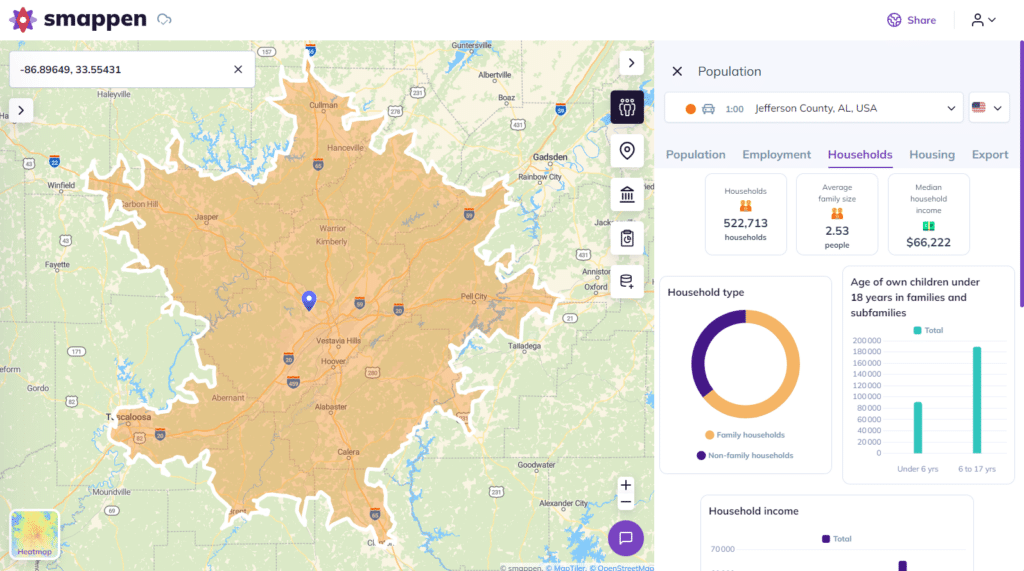
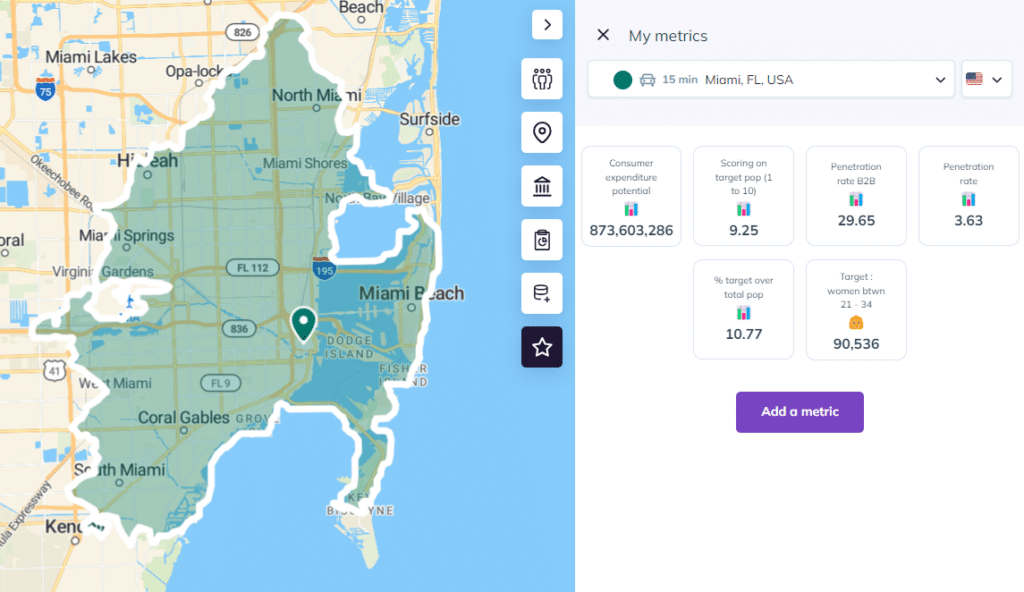
- Pull demographic metrics
In Smappen’s “Demographics” panel, you’ll find population size, age distribution, average income, household types, housing tenure and more.
For example: How many households are homeowners vs renters? What’s the median household income? What age brackets dominate
3. Overlay competitive and POI (Point of Interest) data
See where existing businesses lie, where high-traffic services are (schools, transit, retail hubs). This helps you interpret demographic data with context.
4. Interrogate the findings
Ask: Is the demographic profile a match for my brand or service? Is there enough volume? Are there underserved pockets?
Example: Maybe the area has strong population but low median income — might affect product pricing or service offerings.
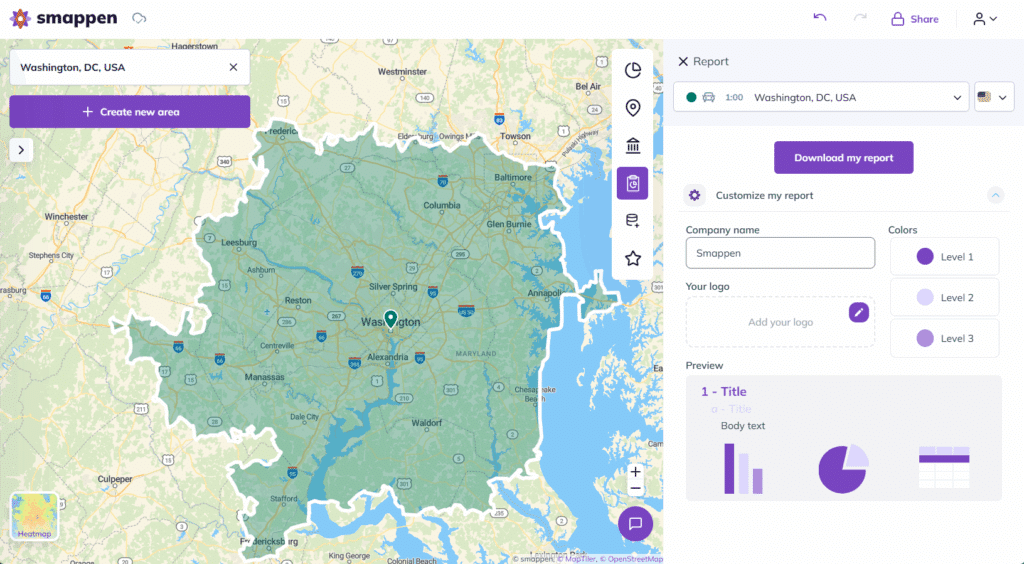
5. Export your findings and act
With Smappen you can export reports (spreadsheets, maps) and share with your team or potential franchisees.
Then, decide: open new unit, adjust marketing targeting, define franchise territory (more on this next) or refine the zone.
Why This Approach Won’t Break the Bank
You may be thinking: “Sure, but won’t mapping and demographic tools cost a fortune?” Actually, the market has changed. Platforms like Smappen are designed with business-friendly pricing and don’t require you to bring in expensive GIS consultants or invest in years of training. The benefits:
- Lower initial cost: You can start with core features (drawing zones, pulling demographic data) without buying a full enterprise suite (and without commitment).
- Less waste: By using real data you avoid poor location decisions or marketing spend in non-target zones—so you save money downstream.
- Scalability: As your business grows (more units, more territories, larger datasets) you can scale up your subscription rather than paying upfront huge amounts.
- Faster ROI: The quicker you pinpoint the right area, the faster you see results: better unit performance, more efficient marketing, fewer errors in territory planning.
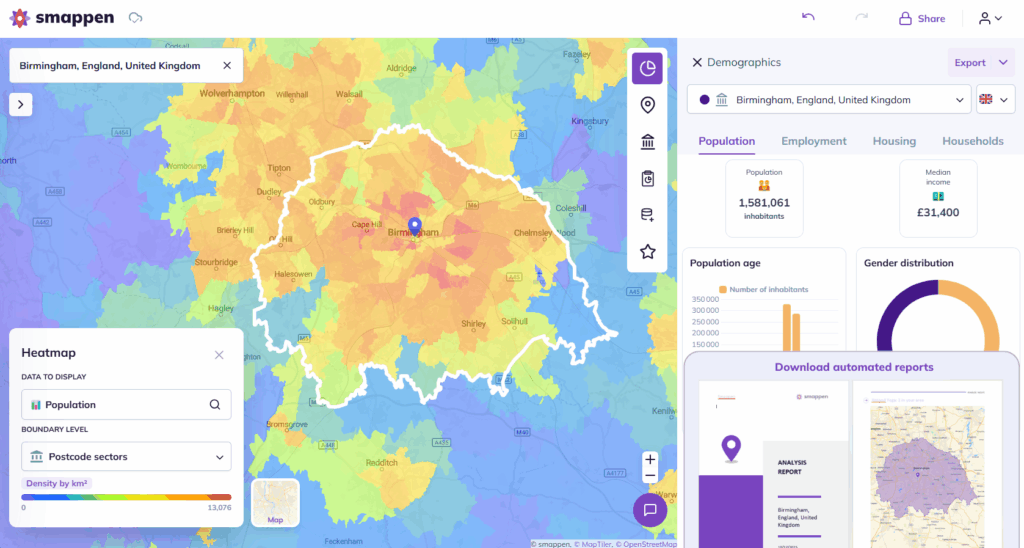
Step 3 – Visualize & act on the insights
Smappen isn’t just data in a spreadsheet—it lets you layer heatmaps (e.g., income density, population clusters) on top of your map.
Then you review: Are there un-served pockets of high-income households? Are you drawing territory lines that overlap with existing stores? Is the site reachable by major roads?
Once you’ve examined that, you can export reports, share with your team or franchisees, and make data-backed decisions.
Some Practical Use-Cases for Business Owners & Franchisors
Here are concrete ways you can use demographic analysis (and Smappen) in your business:
Use-case A: Opening a new retail location
You’re a small business owner and planning your first store. You pick three candidate sites.
- Draw a 30‐minute drive-time zone around each in Smappen.
- Pull population numbers, median incomes, household size and check for competitor density.
- Choose the site that not only has traffic potential, but a demographic profile aligned with your target customer.
You avoid opening at a “nice corner” that turns out to have the wrong customer base.
Use-case B: Franchise rollout & territory fairness
You’re a franchisor and want to onboard three new franchisees in a metro region.
Using Smappen you draw prospective territories for each, ensure each zone meets a minimum population/income threshold, ensure drive times are manageable, and check that no zone overlaps another’s market.
You export the maps, show them to the prospects, and they feel confident you’ve balanced opportunity.
The network grows more sustainably and franchisees feel valued.
Use-case C: Local marketing campaign efficiency
You’re running regional digital marketing across multiple ZIP codes and want to concentrate budget where your best customers live.
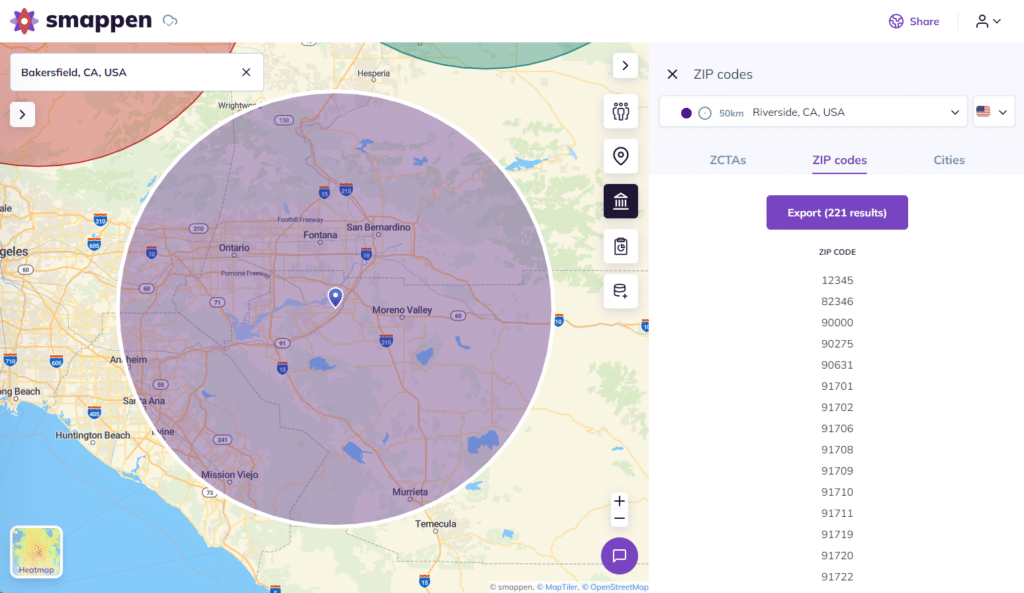
You use Smappen to map ZIP codes where household income > $80k and population age 25-44 is high, within a 15-minute radius of your service point.
You flag those zones for targeted ads, avoid wasteful zones, boost your campaign ROI. You export ZIP code lists or map layers to feed into your ad platform.
Tips & Best Practices for Making the Most of Demographic Analysis
Here are some friendly tips to get maximum value:
- Don’t over-engineer from day one: Start with the big levers (population size, income level, drive‐time) and refine as you go.
- Validate the map with real business sense: Even if an area has strong numbers, check access, visibility, parking, foot traffic — humans still matter.
- Update periodically: Demographics shift. Use your tool to reassess zones annually or before major decisions.
- Combine internal data with external: If you have CRM or customer data, import it into Smappen (you can) and compare your actual customer base with the demographic profile.
- Tell a story with the map: When you present your findings to stakeholders or franchisees, use visuals and narratives. Show “here’s where our ideal customer lives”, “here’s an underserved pocket we should tap”.
- Keep budget in mind: Choose the features you need now; add advanced ones later (scoring, custom indicators) rather than paying for everything upfront.
Common Missteps (and How to Avoid Them)
- Relying solely on one metric: Don’t pick a site just because “median income is high” — check population size, age mix, access.
- Ignoring context: Even the right demographics won’t work if a site is hard to reach, has strong competitors, or poor parking.
- Overlapping territories: For franchisors, giving too much territory overlap among units can erode margins and cause internal conflict. Territory mapping tools help avoid that.
- Treating zones as “set and forget”: Market dynamics change. Revisit areas, adjust if required.
- Choosing expensive, overly complex tools: You can often get everything you need with a business-oriented, lower-cost tool like Smappen rather than custom GIS software.
Final Thoughts: Smarten Your Decisions, Not Just Your Maps
In the end, demographic analysis is less about collecting mountains of data and more about gaining clarity — clarity about who your customers are, where they live, and how you reach them. And you don’t need a massive budget, an army of analysts, or years of training to do it right.
A tool like Smappen gives you the mapping power, data overlays, and usability to step confidently into your next growth phase. Whether you’re a business owner picking your second store, or a franchisor setting up territories across a region, you can shift from “we hope this works” to “we’ve got the numbers—and here’s our plan”.
Now’s the time to let geography work for you, not against you. Define your zones, overlay your data, read your insights—and then take action. Real growth is just around the corner.
From customers, with love
Explore real use cases and get inspired by our customer stories to know what you can achieve easily with Smappen.
Ready to Map Smarter?
No matter where your team is — or where you’re expanding — Smappen helps you map smarter, faster, and with more impact.
FAQ's - Demographic Analysis Tools
Can I really do demographic analysis without hiring a GIS specialist?
Yes. Modern tools like Smappen are designed for business users without deep mapping or GIS expertise. They offer intuitive interfaces, drive‐time drawing, and plug-in demographic datasets so you can get meaningful results on your own.
How do I know which zone size to use for analysis (radius vs drive‐time vs ZIP code)?
It depends on your business model: for a convenience store you might use a 5-minute drive time radius; for a destination store maybe a 30-minute drive time; for automatic logistics maybe ZIP/county boundaries. The key is choosing a zone that reflects your typical customer reach.
What budget considerations should I keep in mind?
Look for tools with tiered pricing (start small, grow later). Make sure you only pay for features you’ll use now (e.g., drawing zones, demographic overlays) and avoid paying upfront for advanced analytics unless you need them. Smappen offers flexibility and is built for cost-conscious users.
How often should I review my demographic zones and data?
At minimum once a year—because population, income and household composition change over time. Also revisit when you’re considering expansion, launching a major campaign or noticing performance drop in a zone. Treat your zones as dynamic, not static.