TL;DR - Demographic Map Data
- Discover how demographic map data can instantly unlock market insights for your business.
- Learn how the feature in Smappen helps business owners, marketers and franchisors map audience traits (age, income, employment) and align expansion strategy.
- See actionable steps for using Smappen’s demographic mapping tool to drive smarter location, marketing and growth decisions — and how to get started.
Whether you’re a business owner scouting a new store location, a marketer seeking high-impact zones, or a franchisor mapping territories, you’ve likely asked yourself: “Where are my customers? Who are they? And how can I reach them more effectively?” With Smappen’s demographic map data, your questions turn into answers.
What Exactly Is Demographic Map Data & Why It Matters
At its core, demographic map data ties socio-economic attributes (like age, income, household type, population density) to geography—so instead of asking “Is there foot traffic here?” you ask “Are the right people here?”
Why does that matter for you? Because being in the right location, speaking to the right audience, and planning with insight rather than instinct is what separates ambitious growth from “we’ll hope it works”.
Think of it like this: most businesses throw darts and hope they hit the board. With demographic map data you’re using a laser pointer and targeting the bullseye.
How Smappen Brings Demographic Map Data to Life
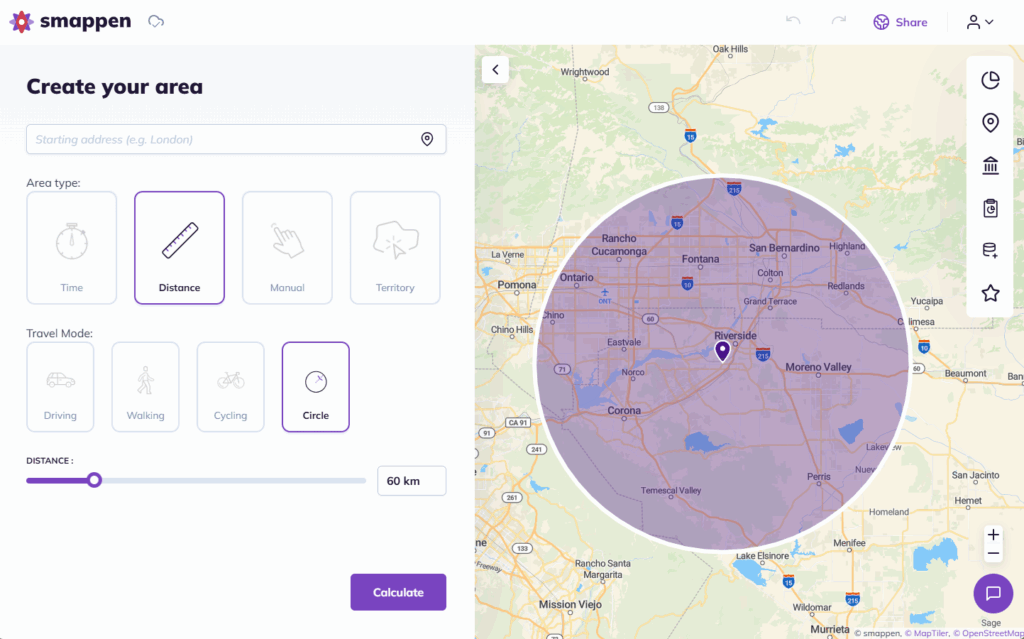
Step 1 – Define your area
You begin by drawing a zone in Smappen. Options include:
A simple radius from a point (e.g., 5 miles around a store)
A “drive-time” polygon (how far someone can drive in 10/15/30 minutes)
- Administrative boundaries (ZIP codes, counties etc)
- Or even custom shapes you draw manually (great for irregular territories)
Step 2 – Tap into the demographic data
Once your zone is defined, you go to the”Demographics” panel in Smappen. You’ll access metrics such as: number of people, age breakdowns, gender split, median income, household types, housing tenure and more.
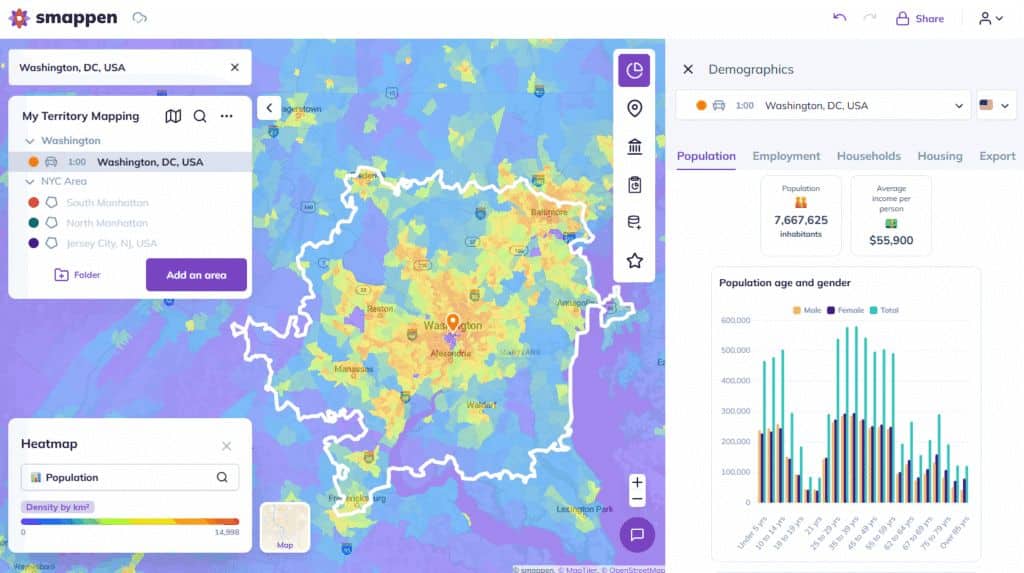
Step 3 – Visualize & act on the insights
Smappen isn’t just data in a spreadsheet—it lets you layer heatmaps (e.g., income density, population clusters) on top of your map.
Then you review: Are there un-served pockets of high-income households? Are you drawing territory lines that overlap with existing stores? Is the site reachable by major roads?
Once you’ve examined that, you can export reports, share with your team or franchisees, and make data-backed decisions.
Why Business Owners, Marketers & Franchisors Love It
Let’s break down how this works based on your role.
For Business Owners
Say you’re opening a new retail location or service center. You want to know: “Is there a market big enough within reachable distance? What’s the income level of residents? Are there too many similar businesses nearby?”
With Smappen’s demographic map data you can check your catchment, evaluate viability, and move from gut-feeling to fact.
You might spot that a site seems promising on its strategic location or traffic alone—but when you overlay income and household types you realize the area skews poorly for your brand. Better to know that upfront.
For Marketers
You’re running regional campaigns and want to target the right neighborhoods. Instead of blanket mailers or wide-net ads, you can focus only on zones with ideal demographics: e.g., households with age 25-34 earning >$75k, within 10 minutes of key locations. Smappen makes targeting much smarter.
Plus, you can visualize where your “best” customers live and identify similar zones you haven’t tapped yet.
For Franchisors
Scaling a franchise means creating territories that are equitable, manageable, and have clear opportunity. With demographic map data you map and compare territories by population, income, households and drive time—ensuring each franchisee starts with a viable market. Smappen even supports exporting zone data for your franchisees.
It also helps avoid cannibalization and overlap by clearly delineating areas based on actual data.
Key Features of Smappen You Should Know (beyond demographic map data)
Here’s a deep dive into what makes Smappen’s demographic map data feature stand out.
Integrated Census & Demographic Datasets
Smappen sources data from official agencies for all the countries covered (U.S., U.K., Canada, France, Belgium, …)—covering population, income, households, employment, housing.
So you’re not guessing—you’re working with verified statistics.
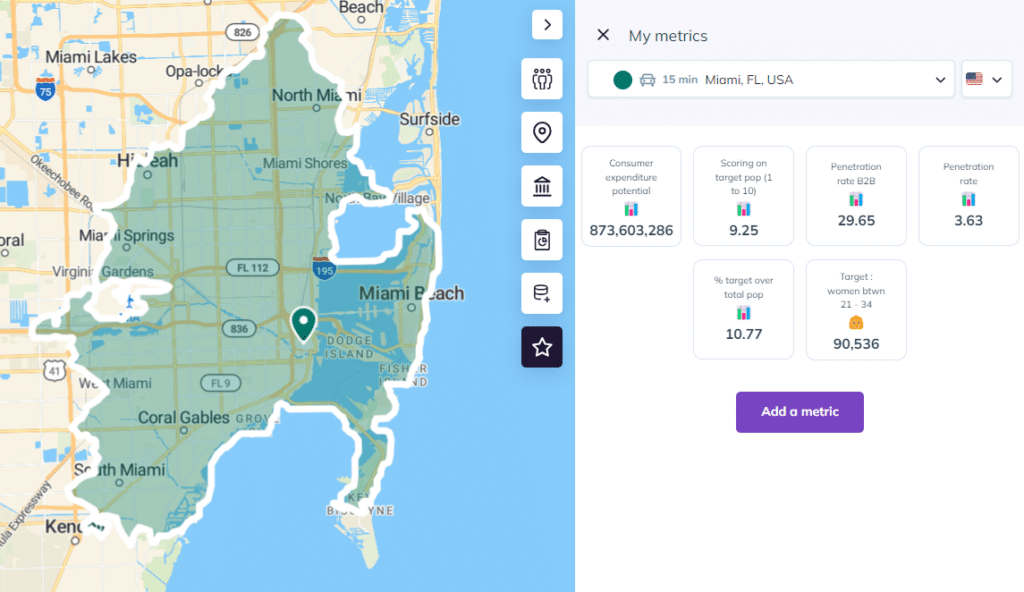
Custom Metrics & Dashboarding
You can define your own “metrics” within Smappen—combine demographic attributes, import your own dataset (CRM, customer list) and evaluate how you stack up.
For example: create a metric for “Adults age 30-45 earning >$80k with children” and then analyze each zone by that metric.
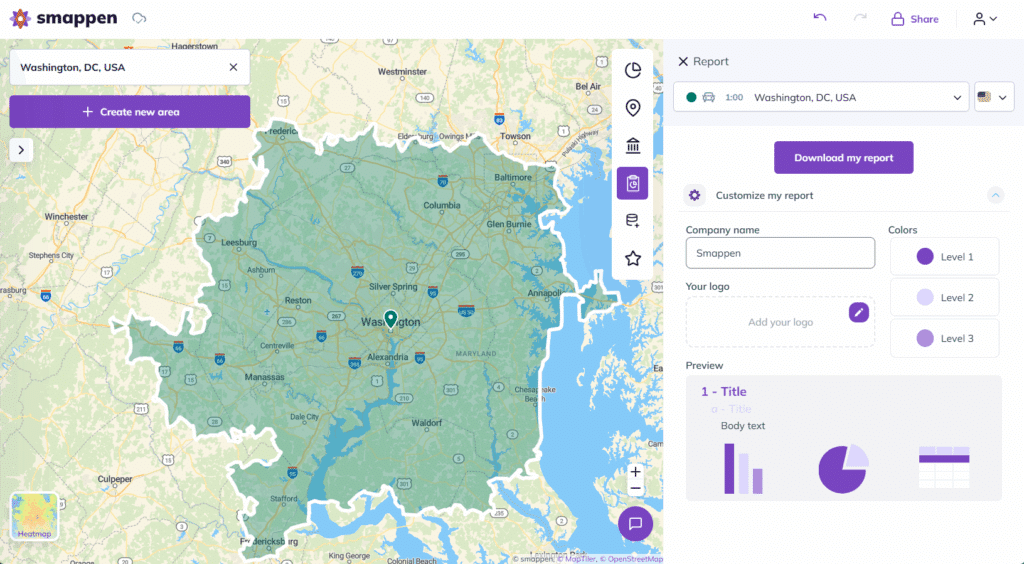
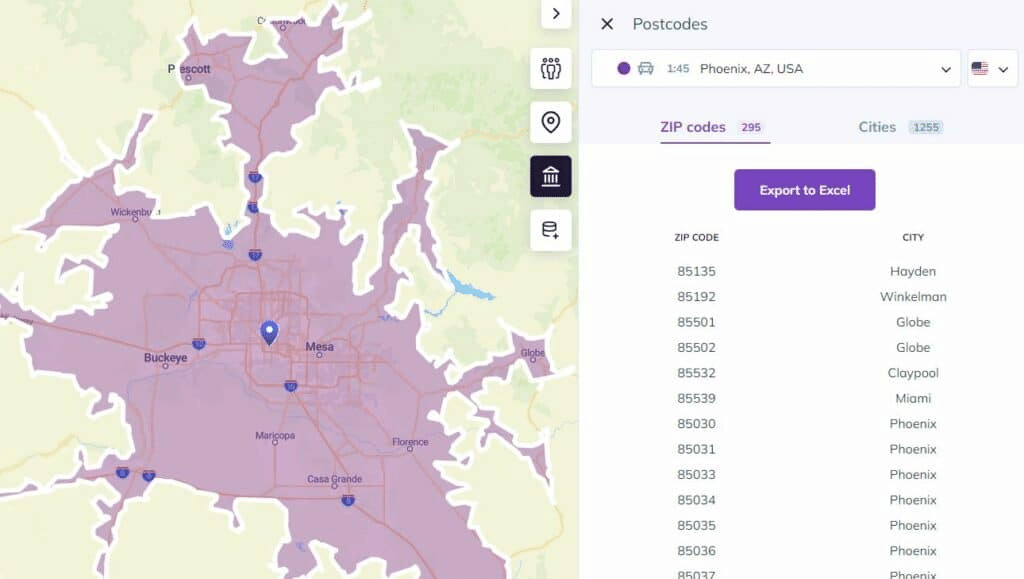
Exportable Reports
After analysis you can download branded reports summarizing area maps, key stats, comparisons with national averages, and even lists of ZIP codes.
Ideal for sharing with partners, stakeholders or franchisees.
Intuitive Area Drawing & Multi-Layer Analysis
You’re not stuck with only a circle: radius, drive-time, ZIP code boundaries, free-hand shapes—all possible. Then you can overlay demographic heatmaps, business POIs, customer data.
How to Use Demographic Map Data for Strategic Advantage
Let’s explore three concrete use-cases where you can deploy this feature immediately.
Use-Case 1: Optimizing Store Location
Imagine you’re planning your next retail store in the U.S. Start by plotting a 30-minute drive-time area around a candidate site in Smappen. Then check:
Total population in that zone
Household income levels
Age and family composition
Housing tenure (owners vs renters)
If the numbers check out (e.g., strong population, target income, correct household types), you move ahead. If not, you either refine the boundary, choose a new site, or do additional investigation.
Use-Case 2: Designing Franchise Territories
As a franchisor you’re dividing a state into territories. In Smappen you draw multiple polygons, assign each a drive-time or population target, then pull demographic stats for each. You ensure:
Each territory has comparable population or income potential
No major overlap between adjacent territories
Accessible drive-times for the franchisee
You then export the territory maps with data and share with your franchisees.
Use-Case 3: Targeted Marketing & Media Planning
You’re launching a direct mail, digital ad, or field marketing campaign.
Using Smappen you:
Create zones around candidate neighborhoods (radius or drive-time)
Pull demographic data for those zones (age, income, households)
Rank zones by “target fit” (highest density of your ideal customer)
Export the ZIP codes or map layers and feed them into your ad platform or mailing list
Monitor results and adjust zones next iteration
This way your budget is spent where your audience lives, not where you hope they are.
What Makes Smappen’s Demographic Map Data Feature Stand Out
Why choose Smappen over generic mapping or data tools? Here’s what differentiates it.
Ease of use for non-GIS professionals: Smappen doesn’t require you to be a mapping expert. The interface is designed for business users.
Built-in demographic and business data: No need to source raw census files, clean them, import them—Smappen integrates them.
- Flexible, business-centric area drawing: Drive-time mapping, radius, manual shapes, ZIP codes—all in one tool.
- Exportability and shareability: You can generate reports, export lists, share zones with your team or clients.
- Franchise and territory friendly: The tool explicitly targets franchisors, marketers and business owners rather than purely GIS users.
Final Thoughts – Map with Confidence, Grow with Insight
At the end of the day, business success boils down to one simple idea: be in the right place, speak to the right people, and execute at the right time. With Smappen’s demographic map data you amplify that idea. You move from assumptions to evidence. From guesswork to strategy. From hoping it works to knowing it will.
So if you’re serious about growing — whether you’re a business owner opening a new location, a marketer aiming for precision, or a franchisor orchestrating expansion — don’t leave your next move up to chance. Use demographic map data, draw your areas in Smappen, let the numbers speak—and then make your move.
Start mapping smarter. Reach further. Grow faster.
From customers, with love
Explore real use cases and get inspired by our customer stories to know what you can achieve easily with Smappen.
Ready to Map Smarter?
No matter where your team is — or where you’re expanding — Smappen helps you map smarter, faster, and with more impact.
FAQ's - Demographic Map Data
What exactly counts as “demographic map data” in Smappen?
In Smappen this includes—you’ll find metrics such as total population, age and gender distribution, average/median income, household composition and size, housing tenure (owned vs rented), employment status and more.
How do I use demographic map data for a franchise territory strategy?
You’d define each territory area in Smappen (drive-time, radius, ZIP codes), pull demographic stats (population, income, households), and compare territories side-by-side. Then you adjust boundaries to ensure each territory has fair opportunity, export to franchisees and onboard them with data.
Will using demographic map data guarantee success?
No tool guarantees success. What demographic map data does is give you insight—with Smappen you’ll have a far better idea of who lives where and what potential a zone holds. But you still need to execute well, understand competition, and bring your brand value. Use the data as a powerful foundation, not as a silver bullet.