Florida map with counties and demographics
Looking for a map of Florida with counties and population data?
This interactive Florida map lets you explore demographics at both state and county level — population density.
The map is powered by Smappen, a geomarketing platform that makes data exploration simple and visual.
With Smappen, you can build your own custom data maps in just a few clicks: draw territories, compare regions, and analyze demographics, businesses, or points of interest anywhere in the US.
How do I use this Florida demographics map?
Demographics
Using the map is simple:
Open the interactive map.
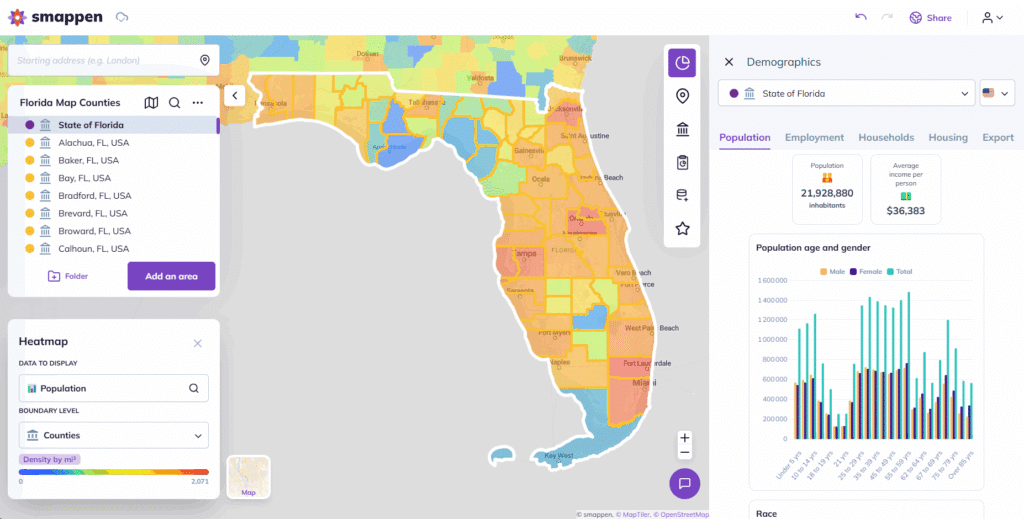
Click on the right panel and select the first button to display demographic data.
Click on any county to view to view demographics.
Population density heatmap
To use the heatmap:
Click on the heatmap tab at the bottom left of the screen.
Select “Population” in the Data to display tab and “Counties” in the Boundary level tab.
The heatmap appears in a few seconds.
- The population density per square mile is visible on the slider at the bottom of the heatmap tab.
About Florida Map
This Florida demographics map is part of Smappen’s collection of Custom Data Maps.
Instead of static images, each map is interactive: you can zoom into counties, highlight population data, and visually compare areas across Florida.
Whether you’re searching for a Florida population density map, a map of Florida counties with demographics, or simply want to understand how the state is structured, this tool makes it easy to explore.
👉 With Smappen, you can go further: switch between themes (business locations, services, demographics), create your own areas, and export insights to support research, planning, or franchise development.
FAQ - Florida Map with Population Data
This interactive map displays state and county population density across Florida. It helps you spot patterns and compare areas visually.
Unlike a static image, this demographics map is interactive. You can zoom in, highlight counties, and explore population data directly on the map.
Yes! With Smappen, you can build your own custom data maps in just a few clicks, using demographics, businesses, or points of interest.